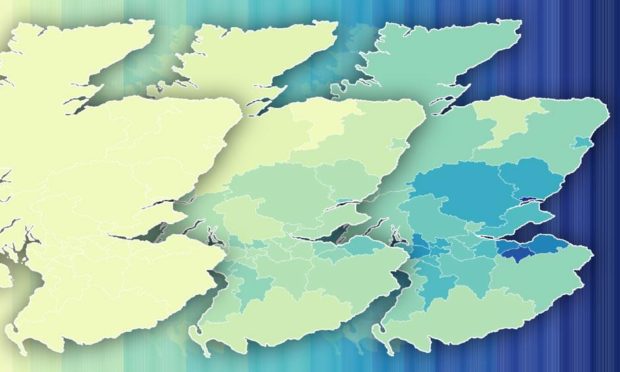
Covid case rates are increasing exponentially in Scotland. We took a look at how these rates have changed across Aberdeen and the north east, going back to the start of the pandemic.
We’ve put together animated maps which help to put the current case rates into context. Click play on them to see the complete timeline.
By local authority area, Dundee City currently has the highest seven day case rate per 100,000 population. The map below shows how the distribution has changed over time.
For a more localised picture we analysed date from Public Health Scotland which shows the rates in smaller neighbourhood areas.
North and North East
Cases in the North and North East have not seen the same kind of increases as in other areas such as Dundee and Edinburgh. However, there are some areas with high rates.
The highest current rates are in the Cove North neighbourhood, which has a rate per 100,000 people of 998. At the other end of the scale, the North East has many areas that have so few cases the rate has been suppressed by Public Health Scotland.
The animated map below shows the timeline of the case rate across the region, showing the times when there have been very few cases at all and the various surges across the different waves of the pandemic.
