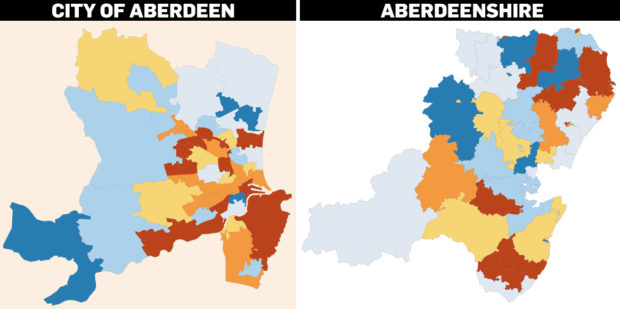
The latest official figures showing the spread of coronavirus across Aberdeen and Aberdeenshire give an idea of how your community is affected.
The regions are broken down into smaller community areas and show the number of Covid-19 cases from November 21-27.
That number can also be put into context – by saying how many cases there have been per 100,000 population.
The Scotland-wide seven-day positive rate per 100k population is 110.9 cases.
Aberdeen has an average rate per 100k population of 88.8 up from 57.7 last week, while Aberdeenshire’s is up from 63.2 to 91.5,
Glasgow city, which is in level 4, is recorded as 168.8, down from 215.1 the previous week
Figures have shown that cases in many areas over the past week, however, the number of cases in Aberdeen has increased from 132 to 201 for the seven day period.
In Aberdeenshire, the number of cases has increased from 165 to 239.
Aberdeen now has 14 areas in the highest 100 and over category, down from nine last week, including Ashgrove, city centre east, Cove North, Mastrick, Northfield, Old Aberdeen and Torry. Combined the 14 areas have 117 cases.
Use the slider below to compare the latest figures with the last seven-day period.
In Aberdeenshire 18 areas now fall into that category, two more than last week, with around 98 cases.
The areas include Auchnagatt, Banchory, Crathes and Torphins, Ellon West, Fraserburgh, Longside and Rattray, Macdufff, Mearns and Laurencekirk, Mintlaw, New Pitsligo, and parts of Peterhead.
However, the map shows there are six areas in the city and eight in Aberdeenshire with no Covid cases.
Use the slider below to compare the latest figures with the last seven-day period.
https://www.eveningexpress.co.uk/fp/news/specials/coronavirus-in-scotland-track-the-spread-in-these-charts-and-maps3010/
