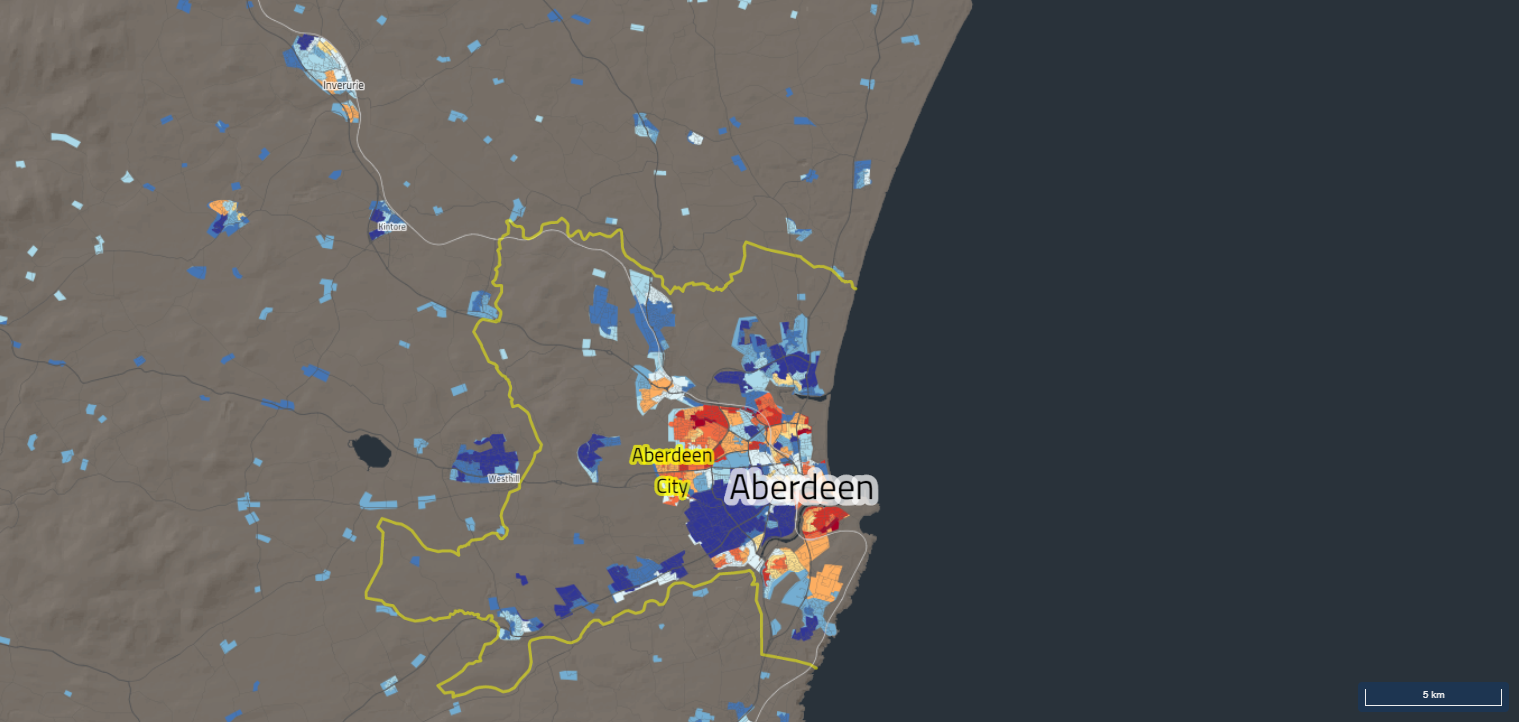
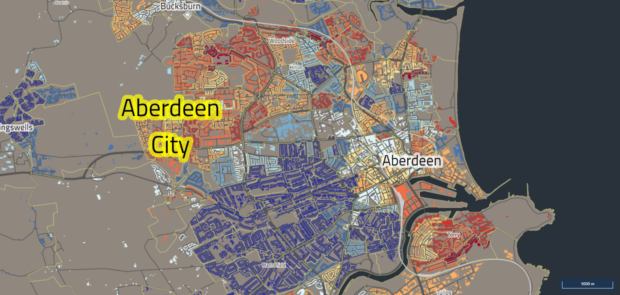
New figures showing the most and least deprived areas of Aberdeen have been published today.
The Scottish Index of Multiple Deprivation (SIMD) identifies areas where “people are experiencing disadvantage across different aspects of their lives”.
The data takes into account a variety of factors including health, employment, housing and crime.
Part of Woodside was listed as the most deprived area of the city, according to the latest stats.
Areas in Middlefield, Seaton and Torry were described as being in the bottom 10% of deprived areas in the region.
And parts of Stockethill, Mastrick, Heathryfold, Tillydrone and Kincorth are all in the bottom 20%.

Meanwhile, Craigiebuckler, Mannofield, Ferryhill, Rosemount, Bridge of Don and the eastern edge of Cults are all in the top 10% least deprived areas.
In Scotland, the least deprived area is Stockbridge in Edinburgh, with the most deprived area listed as Greenock town centre.
Previously the most deprived area in Scotland was Ferguslie Park in Paisley.
As a whole Aberdeen City was ranked 18th, out of 33 areas in Scotland.
According to analysis of the data, the levels of deprivation has increased in Aberdeen City and Moray, however, neither of these increases are greater than 2%.
Scotland’s Chief Statistician, Roger Halliday, said: “I welcome these statistics and the work done to make this complex information more easily accessible.
“I know how widely the Scottish Index of Multiple Deprivation is used as a vital resource for local planning, by third sector organisations bringing together resources needed to do their great work, and by many others.
“However, we must also focus on the strengths and assets of communities if we are to work together to make Scotland a fair and inclusive place to live.”
What is the Scottish Index of Multiple Deprivation (SIMD)?
The Scottish Index of Multiple Deprivation (SIMD) is a tool for identifying the places in Scotland where people are experiencing disadvantage across different aspects of their lives. SIMD ranks nearly 7,000 small areas, or data zones, covering the whole of Scotland from the most deprived to the least deprived and reports statistics on income, employment, health, education, access to services, crime and housing.
SIMD is a relative measure which shows whether one area is more deprived than another, but it does not say how much more deprived. A change in level of deprivation, or SIMD rank, shows that the relative deprivation compared to other parts of Scotland has changed, but this does not necessarily mean that the area has changed in an absolute sense.
Deprivation in larger areas, such as local authority areas, is measured by the proportion of data zones in that area which are classified as ‘deprived’. The choice of cut-off level, such as 15% or 20% most deprived areas, will depend on the purpose of the analysis.
SIMD is used to help organisations invest in areas most in need. It can also be used by communities to highlight the things that matter to them, and identify opportunities to improve the lives of local people.
SIMD identifies deprived areas, not people. Over half of people on low income do not live in the 20% most deprived areas in Scotland. So using SIMD to identify individuals experiencing deprivation will not work in some areas, such as remote rural areas and the islands.
How SIMD was made
Scotland is split into 6,976 small areas, called “data zones”, with roughly equal populations.
The data uses indicators to measure the different aspects of deprivation in each data zone, like pupil attainment, travel time to a GP, crime and unemployment.
The data is then grouped from over 30 indicators of deprivation into seven types, called “domains”.
These seven domains are then combined into one index, ranking each data zone in Scotland from 1 (most deprived) to 6,976 (least deprived).
