Calendar An icon of a desk calendar. Cancel An icon of a circle with a diagonal line across. Caret An icon of a block arrow pointing to the right. Email An icon of a paper envelope. Facebook An icon of the Facebook "f" mark. Google An icon of the Google "G" mark. Linked In An icon of the Linked In "in" mark. Logout An icon representing logout. Profile An icon that resembles human head and shoulders. Telephone An icon of a traditional telephone receiver. Tick An icon of a tick mark. Is Public An icon of a human eye and eyelashes. Is Not Public An icon of a human eye and eyelashes with a diagonal line through it. Pause Icon A two-lined pause icon for stopping interactions. Quote Mark A opening quote mark. Quote Mark A closing quote mark. Arrow An icon of an arrow. Folder An icon of a paper folder. Breaking An icon of an exclamation mark on a circular background. Camera An icon of a digital camera. Caret An icon of a caret arrow. Clock An icon of a clock face. Close An icon of the an X shape. Close Icon An icon used to represent where to interact to collapse or dismiss a component Comment An icon of a speech bubble. Comments An icon of a speech bubble, denoting user comments. Comments An icon of a speech bubble, denoting user comments. Ellipsis An icon of 3 horizontal dots. Envelope An icon of a paper envelope. Facebook An icon of a facebook f logo. Camera An icon of a digital camera. Home An icon of a house. Instagram An icon of the Instagram logo. LinkedIn An icon of the LinkedIn logo. Magnifying Glass An icon of a magnifying glass. Search Icon A magnifying glass icon that is used to represent the function of searching. Menu An icon of 3 horizontal lines. Hamburger Menu Icon An icon used to represent a collapsed menu. Next An icon of an arrow pointing to the right. Notice An explanation mark centred inside a circle. Previous An icon of an arrow pointing to the left. Rating An icon of a star. Tag An icon of a tag. Twitter An icon of the Twitter logo. Video Camera An icon of a video camera shape. Speech Bubble Icon A icon displaying a speech bubble WhatsApp An icon of the WhatsApp logo. Information An icon of an information logo. Plus A mathematical 'plus' symbol. Duration An icon indicating Time. Success Tick An icon of a green tick. Success Tick Timeout An icon of a greyed out success tick. Loading Spinner An icon of a loading spinner. Facebook Messenger An icon of the facebook messenger app logo. Facebook An icon of a facebook f logo. Facebook Messenger An icon of the Twitter app logo. LinkedIn An icon of the LinkedIn logo. WhatsApp Messenger An icon of the Whatsapp messenger app logo. Email An icon of an mail envelope. Copy link A decentered black square over a white square.

Experts ‘surprised’ as Aberdeen house prices rise towards end of 2020

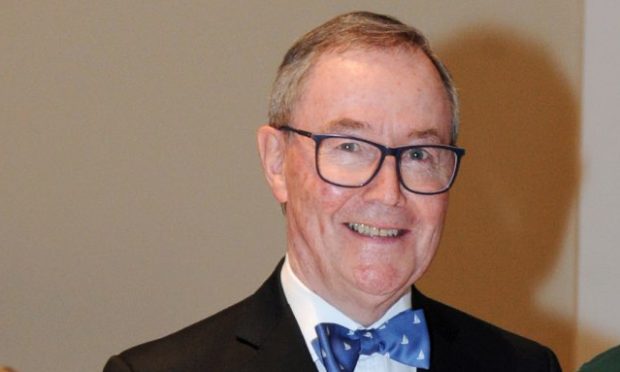
ASPC chairman John MacRae was left surprised by the latest Aberdeen house prices

Property bosses have been left “surprised” after the Aberdeen and Aberdeenshire housing market bucked its typical end-of-year slump.

More homes were sold in the last three months of 2020 than any other period over the last five years.

Additionally, house prices throughout the region increased almost across the board during the quarter – but are still lower than they were in previous years.

New figures have been compiled by the Centre For Real Estate Research (CRER) at the Aberdeen University Business School, using data from the Aberdeen Solicitors Property Centre (ASPC).

House prices rise over year

It found that the average price of a standard semi-detached house in the city rose by 3.3% between September and the end of December, and almost 5% when taking into account the whole of 2020.

Despite this, prices are around 4% down on what they were five years ago.

The statistics show that homes in Aberdeen were almost 5% dearer at the end of the year than the start, while there were increases of 6.4% and 5.6% in Inverurie and Stonehaven, respectively.

Prices for countryside properties remained flat, while those in Ellon dipped 6.5%.

Sales numbers up

The CRER research found that nearly 1,600 properties traded hands during the last three months of 2020.

This included 466 flats – 34% more than during July to September – and 587 semi-detached homes.

Additionally, 539 detached houses were sold, marking a 54% increase on the same period in 2019.

The ASPC also tracks the selling prices of property against what owners were hoping to receive.

On average, homes sold for 99% of their asking price – the highest rate for a number of months.

Figures provide ‘welcome surprise’

Chairman John MacRae said the findings were a “rather welcome surprise” – but was quick to pour water on speculation they could indicate any longer-term shifts.

“I think the figures may be reflecting a particular set of circumstances rather than a trend,” he added.

“As we all know last year was very different, with an almost complete cessation of activity from late March until mid-summer, because of lockdown.

“After lockdown ended, our market recovered quickly and activity was at a high level, presumed to be solely down to a ‘catch up’ effect.”

Mr MacRae added: “One thing that was noticeable in late 2020 was that properties coming to market that sold well, were presented well.

“Staging a property is now more important than ever in our very competitive market and sellers should take the time and make the effort to plan their marketing, taking time to assess weak points and, where possible, address them.

“In the last quarter of 2020, those properties that were well presented sold close to, or at, valuation.”