Aberdeen’s Low Emission Zone came into force on June 1 in an effort to boost the air quality and stem pollution.
The low emission zone has faced increased scrutiny in the months running up to enforcement so we take a deep dive into the data behind the move.
We also spoke to Professor Jill Belch, clinical professor at the University of Dundee’s School of Medicine about the impact of air pollution on health and why pollution levels peak at certain times of the year.
Which areas of Aberdeen are tracked?
The Air Quality in Scotland website brings together data from a number of monitoring sites across Scotland in order to track air pollution levels.
In Aberdeen, there are seven different sites- Anderson Drive, Erroll Park, Errol Place, King Street, Market Street 2, Union Street Roadside and Wellington Road.
Erroll Park began being tracked on October 1 2021, while Errol Place closed on September 20 2021.
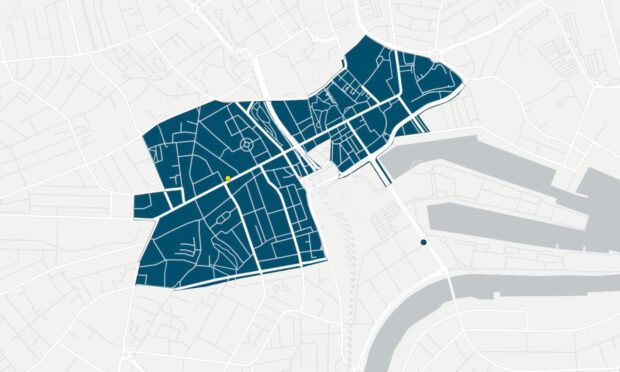
The Low Emission Zone (LEZ) is aimed at improving air quality by only allowing vehicles which pass certain emissions standards to enter the zone.
The area in which it is operational is shown in the map below.
The measuring site on Union Street is the only one that lies within the LEZ.
Market Street and King Street are both partially included within the LEZ, however each of the monitoring sites are outside the area that is in the LEZ.
Aberdeen’s air quality
We have looked at data for daily nitrogen dioxide levels between January 1, 2021 and May 1, 2024 for all seven sites within Aberdeen, including both of the Erroll sites.
While the Scottish Air Quality Objective is an annual mean, it is still helpful to look at daily means as even day-by-day spikes can impact health, according to Professor Jill Belch.
The peak nitrogen dioxide among these measuring sites was observed at Wellington Road on September 9 2021 at 80.5 µg/m3. This is followed by Market Street on May 5 2023 with a level of 74.8 µg/m3.
Wellington Road’s peak is double the target level set of 40µg/m3, while Market Street comes close to double the target.
Union Street, the only site within the LEZ, saw the highest spike in air pollution on January 21 2022, at 69.1µg/m3.
The other streets saw peaks in the 50s.
Across all of the measuring sites in Aberdeen, Wellington Road has the highest average level of nitrogen dioxide.
It also measured the highest peak, and over the past three-and-a-half years, it has seen an average nitrogen dioxide level of 26.6µg/m3.
The second highest average is in Union Street Roadside, which is within the LEZ, at 25.5µg/m3, followed by Market Street at 24.9µg/m3.
Although sites have seen peaks in the 70s and even into the 80s, these are considered low levels of air pollution still.
These levels are based on the hourly mean figure.
No site in Aberdeen has exceeded low levels of nitrogen dioxide since 2021.
However, the World Health Organisation guidelines on air pollution suggest nitrogen dioxide concentrations should not exceed 10 µg/m3 annual average or 25 µg/m3 in the daily mean.
Levels at the Union Street generally do remain within the target, however have reached over double the Scottish target of 40µg/m3 consistently since 2021.
Many of the peaks are recorded within colder months, from October to March, however there have been levels recorded over the targets in warmer months such as June.
Since the LEZ was introduced in 2022, the highest level recorded in Union Street was on June 12 2023, at 57.2µg/m3.
The impact on health
Professor Jill Belch, clinical professor at the University of Dundee School of Medicine, has raised awareness of the impacts of air pollution on adults and children alongside colleagues at the Tayside Pollution Research Programme, which cross-referenced data on admissions to Ninewells Hospital compared to the levels of air pollution.
The research showed that children may be at a higher risk of hospitalisation at lower levels of NOx pollution exposure than adults.
Speaking about the impacts of the LEZ on health, she said: “We looked at high pollution within hospital admissions. For adults and children, there were much higher admissions to hospital on days where there was high pollution.
“There is no safe level in going over the limit. In adults, we were seeing people come in with heart attacks, strokes, lung infections. Children are admitted in lower levels [of air pollution] than adults.
“It doesn’t just cause lung problems in kids, we saw people admitted with gut disease, because pollution dissolves in the saliva. It can affect the skin and causes eczema.
“We are doing a study in two years to compare the hospital admissions, we hope to show the admissions will have gone down.
“Unfortunately there’s not an LEZ covering the whole city but it’s an absolute benefit for the people who work and walk there.”
She added: “If you look at the air pollution data, it goes up in rush hour and down in the evening. If you don’t want to be affected, go out at night.
“A lot of the winter peaks is down to still air. We’ve got those really cold days where the air doesn’t move, and one of the big issues we’ve got in the world is wood burners. We need to make people aware of the issues, it’s like having a diesel truck in your front room.
“In the summer, the pollution is blown away. In summer holidays people aren’t driving as much, in the winter people take their cars more and they also idle to keep themselves warm.
“I’m thrilled to see the LEZ being introduced. People don’t just stop when you get to the LEZ, you’ll get the bus in or get a different car so the areas around it benefit as well.
“If people want to drive in it, they’re going to have to change their car.
“A lot of the issues are in cars like 10-year-old SUVs. Someone who is less well off might opt for a smaller petrol car, and most of them will be okay.
“I think that when the scheme was introduced, people won’t decide to wait until June 1 to get a new car that’s compliant, in the past two years they’ll have already done it so we’ll already be seeing those impacts.”


Conversation