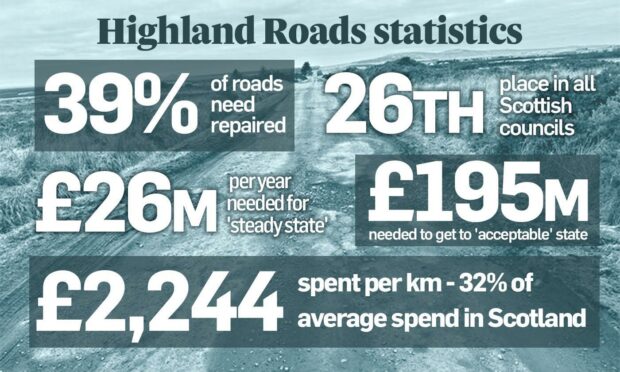
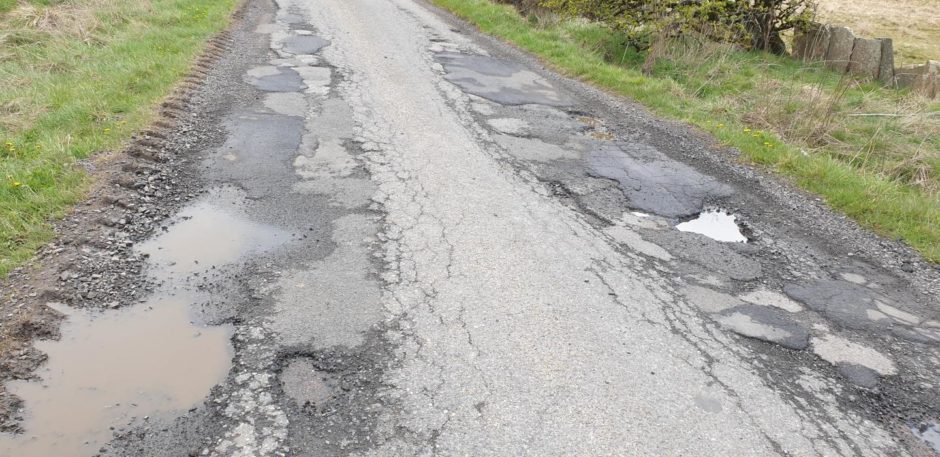
Nearly four in 10 Highland roads need to be repaired and bringing them all up to scratch would cost an eye-watering £195m, it has been revealed.
New data from the Scottish Road Maintenance Condition Survey has shown that Highland Council has plummeted down the national league table.
In 2011, it was 11th out of Scotland’s 32 local authorities. Now it has dropped to 26th.
Tomorrow’s economy and infrastructure committee will discuss the data.
The council needs to invest £26m each year just to keep its roads at a “steady state”.
However, the last five years’ capital has fallen well short of that figure, at £8.2m in 2018-19, £6.2m in 2019-20 and £7.2m the past three years.
In 2020, the council injected an extra £20m into its roads, but a report prepared for the committee says this is not enough.
How does the Highlands compare nationally?
Of course, potholes are a popular bone of contention in more areas than the Highlands.
Local authorities across Scotland struggle to maintain roads, schools and housing against escalating welfare and social services demands.
Yet the north does appear to be falling short of its neighbours.
The Statutory Performance Indicator (SPI) provides the percentage of roads in need of maintenance treatment.
It’s calculated by adding up the roads rated ‘red’ and ‘amber’ after inspection.
In Scotland, the average SPI is 35.5%. The best performing local authority only needed repairs to 23.7% of its roads while the worst needed 54.2%.
In that context, Highland’s 39% score isn’t desperately bad.
However, the national picture is one of incremental improvement.
By contrast, the report going to Highland councillors warns that “without further and sustained funding the condition of the road network will continue to deteriorate and as such our ranking amongst the other Scottish local authorities may drop further”.
The figures back this up. Ten years ago, Highland Council was 11th in Scotland, with only 29.3% of its roads needing repair.
Highland spends £2,244 per km on its roads – 32% of the average spent per km by other local authorities.
Years of under-funding have caused the deterioration, and the council acknowledges that it has got lucky with the weather, after four relatively mild winters.
In short, more money is needed.
Rural areas feel the brunt
Road conditions appears to be worse in rural areas, fuelling an old argument about how they are prioritised for repair.
Generally speaking, roads with higher traffic attract more frequent maintenance than remote rural routes.
In Highland, 41% of rural roads require repairs, against 29% of roads in urban areas.
The methodology of the Scottish Roads Maintenance Condition Survey may also overlook some rural examples.
The survey examines 100% of A-class roads and 50% of B and C roads. However, only 10% of unclassified roads are inspected annually.
This means that some country roads in rural areas could go 10 years without anyone examining them.
Additionally, only 40% of the U roads are included in the sample data, to prevent the figures being skewed.
The report simply asks members of the economy committee to ‘note’ the issues. The real challenge will present itself at budget time next year.

